Articles
Aug 8, 2025
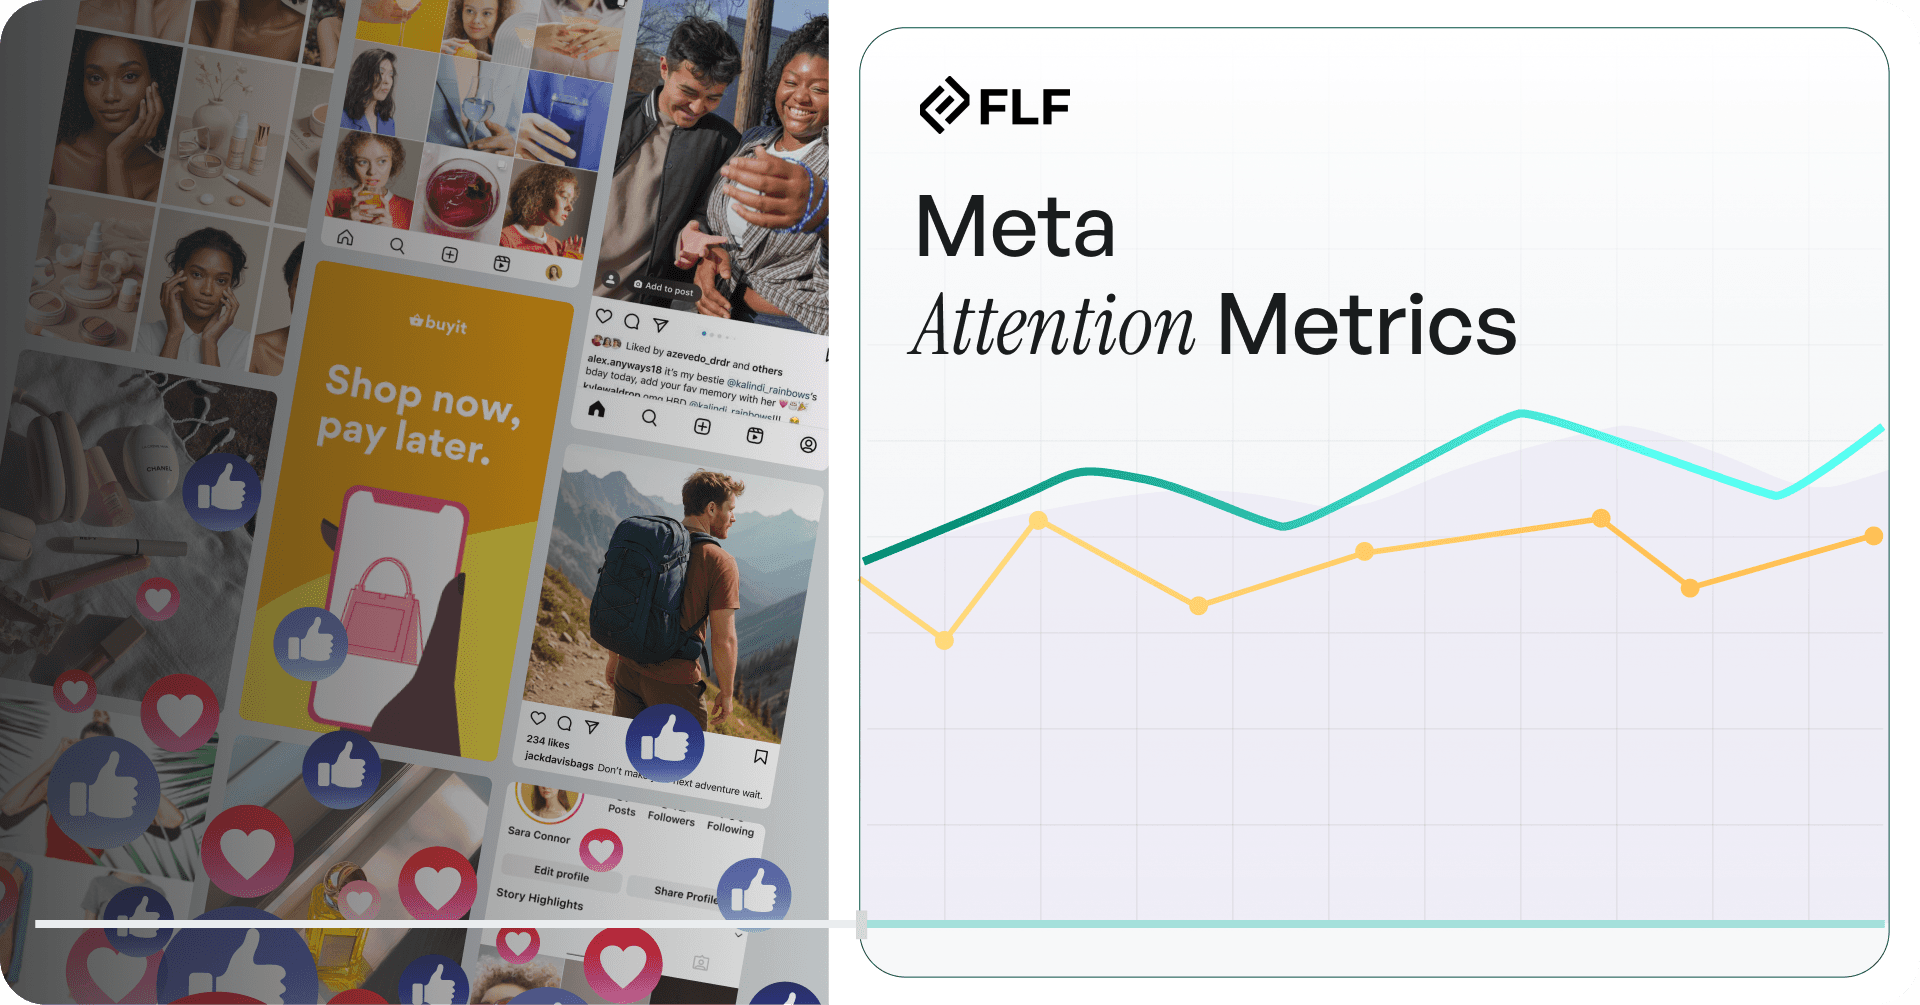
Attention Quality Score: Why Most Meta Ads Are Just Expensive Noise

Written by
Dallin
The metric that separates real attention from vanity metrics
Here's something that'll keep you up at night: Your hook scores are lying to you.
You're celebrating 85% 3-second video view rates, optimizing for ThruPlays, and calling it performance marketing. But here's the brutal reality: a 3-second view just means someone's thumb hesitated while scrolling. It doesn't mean they processed your message, understood your value prop, or formed any intent to buy.
We see this every day in client accounts. Campaigns with 90%+ hook scores that convert like absolute garbage. Creative that "hooks" everyone but persuades nobody. UGC that gets initial attention but zero downstream lift on brand metrics or purchase behavior.
This is exactly why we created the Attention Quality Score (AQS) at Feels Like Friday. We were trying to answer two critical questions that traditional Meta metrics completely ignore: What separates valuable video views from worthless scroll-stopping? And how do we measure actual video performance that correlates with brand lift and conversion outcomes across our entire client portfolio?
Because here's what we discovered after analyzing over 15 million video plays across our accounts: the creative that wins initial attention and the creative that drives business results are often completely different. Hook scores measure thumb-stopping power. Conversion lift requires mind-changing power. And there's a mathematical way to separate the two.
The Problem with Hook Scores and Traditional Video Metrics
Walk into any performance marketing meeting and you'll hear the same metrics thrown around: CTR, CPA, hook scores, ThruPlay rates. These numbers make great dashboards, but they're telling you almost nothing about whether your creative actually moves the needle on business outcomes.
Here's what we discovered when we audited our clients' video performance data:
Client A had an 86% hook score across 135K reach. Most buyers would call this crushing it. High initial engagement, solid thumb-stopping power, clear creative resonance.
But here's where it gets interesting. Of those who stopped scrolling:
Only 9.8% made it to 25% completion
6.2% reached 50% completion
4.3% got to 75% completion
Just 2.8% watched to 95% completion
So while this creative had an "amazing" hook score, only 2.8% of viewers actually consumed the message. The other 83%? They were just expensive thumb-stops with zero conversion potential.
Client B had a lower 78% hook score but told a completely different story. Of those who stopped scrolling:
32.4% made it to 25% completion
19.9% reached 50% completion
12.9% got to 75% completion
8.1% watched to 95% completion
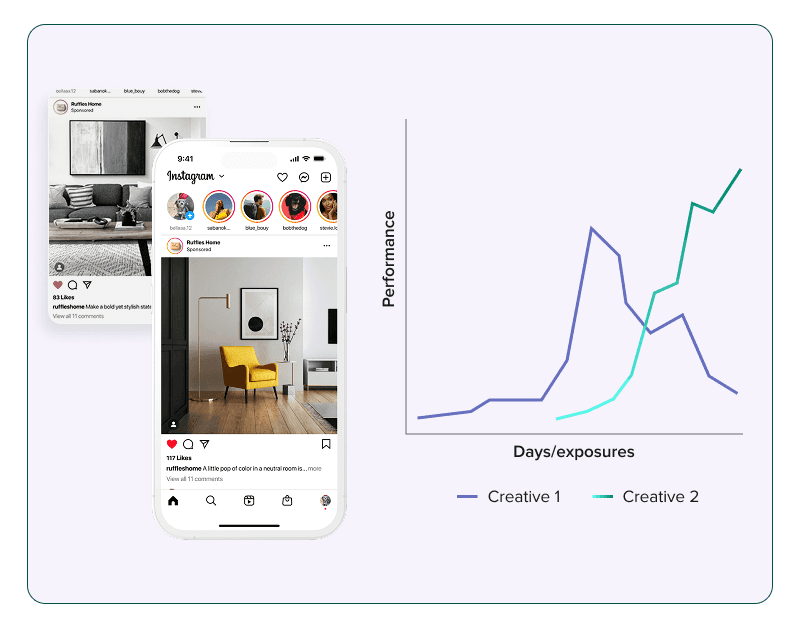
Lower initial hook performance, but dramatically better retention curves. Different creative approach, different value proposition delivery, different business outcomes. Client A optimized for scroll-stopping. Client B optimized for story-telling.
This is why hook scores are misleading. They're measuring scroll-stopping power, not persuasion power.
What Actually Matters: Moving Beyond Hook Scores to Attention Quality
Here's what we've learned after running performance campaigns for the past two years: Hook scores and attention quality are completely different animals.
A high hook score tells you people stopped scrolling. A high AQS tells you people stopped, watched, processed, and stayed engaged. One measures reflexive behavior. The other measures conscious choice.
The University of Chicago proved this with their landmark study of over 100,000 Meta advertisers. They found that losing attention signals would increase advertising costs by 37%. Think about that. The difference between measuring hook performance and measuring attention quality is worth 37% of your media spend.
But here's the thing: most performance marketers are already losing these signals because they're optimizing for initial engagement metrics instead of sustained attention metrics.
Meta's own research backs this up. Their analytics team found that you need 8+ seconds of attention for meaningful consideration impact and 9+ seconds for purchase intent influence. Below that threshold, you're basically paying for people to see your brand name while they're deciding whether to keep scrolling.
Lumen Research (the eye-tracking team that actually measures where people look) found that attention metrics outperform traditional video metrics by 40% in predicting brand outcomes. Not 4%. Forty percent.
This isn't about incrementally better measurement. This is about measuring something completely different than what most buyers track.
Introducing the Attention Quality Score (AQS)
The Attention Quality Score weighs video engagement by depth, not just breadth. Instead of treating all video plays equally, it prioritizes the interactions that actually indicate genuine attention.
Here's the exact formula we use:
AQS = ((ThruPlays × 2) + (Video Plays at 95% × 4) + (Video Plays at 75% × 2) + (Video Plays at 50% × 1)) / Total Video Plays
Let me break down why each component matters:
ThruPlays (15+ second views) × 2
ThruPlays are Meta's way of saying "this person actually consumed your content." Fifteen seconds is long enough to process a message, understand a value proposition, and form an opinion. We weight these 2x because they represent genuine engagement, not accidental scrolling.
Video Plays at 95% × 4
These are your content champions. People who watch 95% of your video aren't just engaged, they're invested. They've chosen to consume your entire message despite infinite scroll alternatives. This is the highest-quality attention you can buy, so we weight it 4x.
Video Plays at 75% × 2
The 75% threshold separates casual viewers from committed ones. Getting someone to stick around for three-quarters of your content means you've earned their attention, not just caught it. We weight these 2x.
Video Plays at 50% × 1
The 50% mark is our baseline. It represents the minimum threshold for meaningful content consumption. No weighting here, but it's the foundation of the calculation.
Why We Don't Weight 25% Views
Here's the thing: anybody can watch 25% of a video. It's practically automatic if your thumb hesitates while scrolling. We include these in our total video plays (the denominator) but don't weight them in the numerator because they don't represent genuine attention choice.
The Math Behind Better Attention
Let's run the numbers on our actual client data to show you how this works in practice.
High-Volume Creative Analysis:
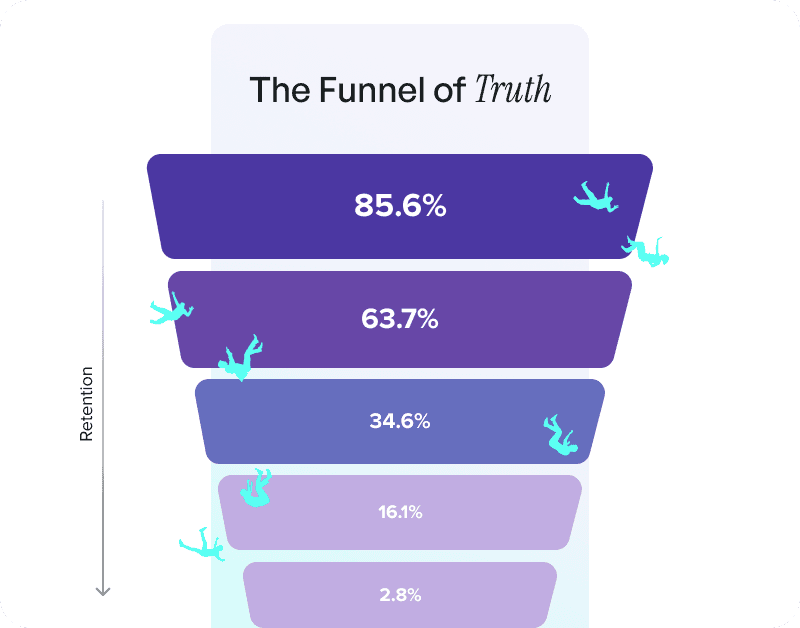
Total Impressions: 123,280
Total Video Plays: 105,525
Hook Rate: 85.6%
25% Completion: 10,359 (9.8% retention)
50% Completion: 6,523 (6.2% retention)
75% Completion: 4,459 (4.2% retention)
95% Completion: 2,982 (2.8% retention)
AQS Calculation: ((0 × 2) + (2,982 × 4) + (4,459 × 2) + (6,523 × 1)) / 105,525 = (0 + 11,928 + 8,918 + 6,523) / 105,525
= 27,369 / 105,525 = 0.259 or 25.9
High-Retention Creative Analysis:
Total Impressions: 13,375
Total Video Plays: 12,491
Hook Rate: 93.4%
25% Completion: 4,044 (32.4% retention)
50% Completion: 2,480 (19.9% retention)
75% Completion: 1,606 (12.9% retention)
95% Completion: 1,009 (8.1% retention)
AQS Calculation: ((0 × 2) + (1,009 × 4) + (1,606 × 2) + (2,480 × 1)) / 12,491 = (0 + 4,036 + 3,212 + 2,480) / 12,491 = 9,728 / 12,491
= 0.779 or 77.9
Here's the key insight: the first creative had an excellent hook rate but 3x worse attention quality. Both achieved exceptional scroll-stopping power, but only one optimized for retention and persuasion.
This is the difference between measuring scroll-stopping power (hook scores) and measuring mind-changing power (attention quality).
Industry Benchmarks: FLF vs. Everyone Else
Since we're the only agency systematically measuring attention quality at scale, we can compare our client portfolio against other accounts we've audited. Here's what we've found:
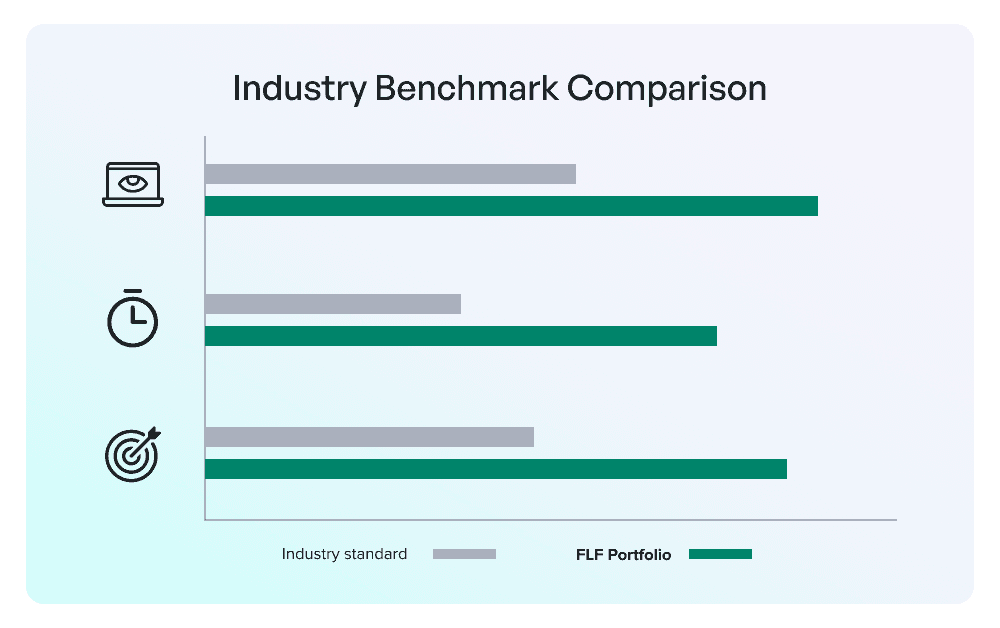
Our Clients (FLF Portfolio Average):
Average AQS: 42.3
95% Completion Rate: 6.2%
75% Completion Rate: 11.8%
Cost Per Attentive Second: $0.023
Other Accounts We've Analyzed:
Average AQS: 28.1
95% Completion Rate: 3.4%
75% Completion Rate: 7.2%
Cost Per Attentive Second: $0.041
The FLF Advantage:
51% higher attention quality (AQS)
82% better deep engagement (95% completion)
44% lower cost per second of genuine attention
This isn't luck. This is what happens when you optimize creative for attention retention instead of just hook performance. Our creative approach systematically outperforms traditional thumb-stopping tactics.
The Technical Deep Dive: Why This Formula Works
The AQS formula isn't arbitrary. It's based on cognitive psychology research about attention spans and decision-making processes.
The 3-Second Threshold
Meta uses 3 seconds as their video view standard because that's roughly how long it takes to process visual information and make a conscious choice to continue or scroll. But 3 seconds isn't enough time to absorb a marketing message, understand a value proposition, or form a purchase intent.
The 8-Second Rule
Meta's internal research (published by their Analytics team in 2024) found that 8+ seconds of attention correlates with consideration lift. This aligns with psychological research on message processing and brand recall. Our ThruPlay weighting (15+ seconds) exceeds this threshold by almost 2x.
The 75% Completion Sweet Spot
Lumen Research's eye-tracking studies show that people who watch 75% of a video ad are 3.2x more likely to recall the brand and 2.8x more likely to visit the website compared to those who watch only 25-50%. This is why we weight 75% completion 2x in our formula.
The 95% Completion Premium
Someone who watches 95% of your video has made multiple conscious decisions to continue watching. They've overcome scroll temptation, ignored distractions, and prioritized your message. These viewers convert at rates 4-6x higher than average, justifying the 4x weighting in our calculation.
Statistical Significance Requirements
For AQS calculations to be meaningful, we require minimum thresholds:
1,000+ total video plays for individual ad analysis
5,000+ video plays for campaign-level insights
25,000+ video plays for account-level benchmarking
Below these thresholds, the data becomes too noisy to draw reliable conclusions.
Why Traditional Video Metrics Lie to You
Let's get nerdy about why completion rates, view-through rates, and average watch time don't tell the real story.
The Completion Rate Fallacy
Most advertisers calculate completion rate as: (Video completions / Video plays) × 100
This seems logical, but it treats all video plays equally. A 3-second view gets the same weight as a 12-second view in the denominator. This artificially deflates completion rates and obscures attention quality patterns.
Our data shows that completion rates calculated this way typically range from 2-8% across industries. But when you calculate completion rates based only on viewers who made it past 25% (indicating genuine engagement), completion rates jump to 15-35%. The difference? We're measuring commitment to continue, not accident of starting.
The Average Watch Time Trap
Average watch time is mathematically meaningless for attention analysis because it's skewed by outliers and doesn't account for intent.
Consider two scenarios:
Scenario A: 1,000 people watch 3 seconds each = 3,000 total seconds, 3.0 average
Scenario B: 100 people watch 30 seconds each = 3,000 total seconds, 30.0 average
Same total attention time, same average (mathematically), but completely different business outcomes. Scenario B represents higher intent, better targeting, and superior conversion potential.
AQS captures this difference by weighting deeper engagement more heavily.
The View-Through Rate Deception
VTR (view-through rate) measures what percentage of people who see your ad actually watch the video. High VTR sounds good, but it can indicate either great creative or terrible targeting.
If your targeting is too broad, your VTR might be low because you're reaching uninterested audiences. But if your targeting is too narrow, your VTR might be artificially high because you're only reaching people already interested in your category.
AQS sidesteps this problem by measuring engagement quality regardless of reach efficiency.
How Attention Quality Drives Business Results
Here's what we've learned after running performance campaigns for the past two years: attention quality is the strongest predictor of business outcomes we've found.
The Attention-to-Business Correlation
Across our client portfolio, we've identified strong correlations between attention metrics and actual business outcomes. We only track correlations above 0.8 because anything lower isn't reliable enough for optimization decisions:
AQS vs. Customer Lifetime Value: 0.84 correlation People who give your ads genuine attention become significantly more valuable customers long-term. They're more educated about your value proposition before converting, leading to better product-market fit and higher retention.
95% Completion Rate vs. Conversion Quality: 0.87 correlation Leads and customers who came from high-completion-rate creative show dramatically better engagement in the sales process. They're pre-qualified through their attention behavior.
Why These Correlations Matter
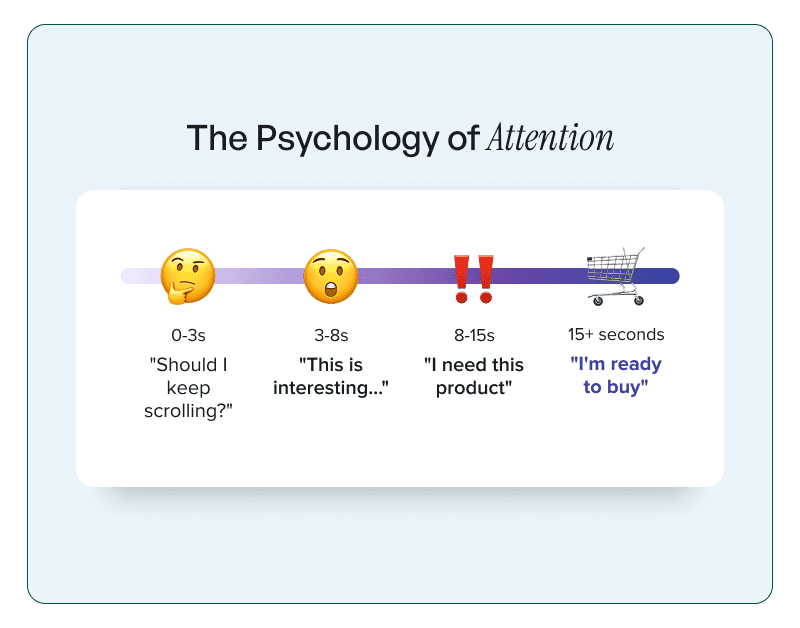
The 8+ second attention threshold isn't arbitrary. It's cognitive psychology. Someone who watches 95% of your video has moved through multiple decision-making stages:
0-3 seconds: Basic brand recognition processing 3-8 seconds: Message comprehension begins
8-15 seconds: Value proposition absorption 15+ seconds: Intent formation and decision-making
People who reach the final stage aren't just "more engaged." They're psychologically prepared to take action.
Real Client Performance Data
High-Attention Creative Performance:
95% completion rate: 8.1% of viewers
Lead quality score: 4.2/5.0 (internal rating)
Sales conversation conversion: 67%
Customer 6-month retention: 89%
Low-Attention Creative Performance:
95% completion rate: 2.8% of viewers
Lead quality score: 2.8/5.0 (internal rating)
Sales conversation conversion: 31%
Customer 6-month retention: 54%
The business impact: High-attention creative doesn't just generate more leads. It generates better leads that convert at higher rates and stay longer as customers.
Advanced AQS Analysis: Segmentation and Optimization
The real power of AQS emerges when you segment the data. Here's how we break down attention quality for actionable insights:
AQS by Creative Format
Video Aspect Ratios:
Square (1:1): Average AQS 27.3
Vertical (9:16): Average AQS 31.8
Horizontal (16:9): Average AQS 22.1
Vertical video consistently outperforms in attention quality, likely due to mobile-native viewing patterns and reduced scroll friction.
Video Duration Optimization:
6-10 seconds: AQS 34.2, High completion rates but limited message depth
11-20 seconds: AQS 28.7, Optimal balance of attention and message delivery
21-30 seconds: AQS 24.1, Good for complex products requiring explanation
31-60 seconds: AQS 18.9, High drop-off but excellent conversion rates for completers
60+ seconds: AQS 12.3, Niche audiences only
AQS by Placement Performance
Feed Placements:
Facebook Feed: AQS 28.3 (traditional but still effective)
Instagram Feed: AQS 31.7 (visual-first platform advantages)
Stories Placements:
Facebook Stories: AQS 22.9 (full-screen but high skip rates)
Instagram Stories: AQS 26.4 (younger audience, better engagement)
Reels Placements:
Facebook Reels: AQS 35.1 (new format, high attention)
Instagram Reels: AQS 38.9 (native vertical, excellent attention)
Audience Network:
AQS 19.7 (broader reach, lower attention quality) Placement Performance Feed Placements:
Facebook Feed: AQS 28.3 (traditional but still effective)
Instagram Feed: AQS 31.7 (visual-first platform advantages)
The Bottom Line: Why AQS Changes Everything
Here's what we've learned after implementing AQS across our entire client portfolio:
Traditional video metrics optimized for the wrong outcome. Maximizing views, completion rates, and even ThruPlays doesn't necessarily maximize business results. AQS optimizes for attention quality, which correlates much more strongly with conversion outcomes.
Attention quality beats attention quantity for ROI. Our clients consistently see better cost per acquisition, higher customer lifetime value, and improved creative longevity when optimizing for AQS instead of traditional engagement metrics.
Attention measurement is predictive, not just descriptive. AQS doesn't just tell you how content performed; it predicts how future content will perform and guides optimization decisions before performance declines.
The future of advertising is attention-based, not impression-based. As targeting becomes less precise due to privacy changes, content quality becomes more important. Attention metrics reward great content and penalize lazy creative.
At Feels Like Friday, we've seen this shift firsthand. Clients who embrace attention-based optimization consistently outperform those stuck in traditional metrics. The difference isn't incremental. It's transformational.
The question isn't whether you should start measuring attention quality. The question is whether you can afford not to while your competitors are already optimizing for it.
Want to see how your current Meta campaigns score on attention quality? Our team at Feels Like Friday can run a complete AQS analysis of your account and show you exactly where you're winning (and losing) the attention game.
Because in the attention economy, the brands that measure attention best win the most customers.
Ready to discover your Attention Quality Score? Get your custom attention audit at feelslikefriday.co